How to Use Your POS Data to Reduce Restaurant Costs: Four Till Reports and What to Change From Each
Your till already shows where a busy venue loses money. Where sales by hour, product mix, voids and discounts, and takings by payment type live in Square, Lightspeed, Epos Now, SumUp and Toast, the decision each one drives, and a worked £ example for each.

Alex Riesenkampff
8 November 2026 · 14 min read · Markdown
Your till already holds the four reports that show where a busy venue loses money: sales by hour and day, product mix, voids, refunds and discounts, and takings by payment type. Read them every Monday for the last four weeks against the four before, and each one points at a decision: which hours to staff, which dishes to push, reprice or drop, who can take money off a bill, and what card payments really cost you.
What a till cannot show you is cost: plate costs come from your supplier invoices and wage costs from your rota.
Where are the reports in Square, Lightspeed, Epos Now, SumUp and Toast?
You read these reports in each till's web back office, on a laptop rather than the till screen, and every till names them differently. All five tills hold the four reports, but Square's comp and void reports only appear once you switch comps and voids on in Square Dashboard.
| Till | Sales by hour and day | Product mix | Voids, refunds and discounts | Takings by payment type |
|---|---|---|---|---|
| Square | Reports > Sales > Sales summary (set the time to Custom and Summary to Daily), or Sales trends | Reports > Custom > Custom item report | Reports > Payments > Discounts, Comps, Voids; refunds in the Sales summary | Reports > Payments > Payment methods, with fees and card origin |
| Lightspeed Restaurant (K-Series) | Reports > Hourly Sales, filtered by day of the week | Reports > All reports > Product Mix Report | Reports > Sales Summary; Reports > Staff performance, expanding a day for each employee | Payments section of Reports > Sales Summary |
| Epos Now | Reporting > Sales Reports > Time Intervals (by date and time) and Time Period (by day) | Reporting > Sales Reports > Sales by Product | Reporting > Auditing > Refunds, Discounts, Void Lines, No Sales, each by staff | Reporting > Banking > Tenders, with each tender's share of turnover |
| SumUp POS Pro | Back Office > Reports > Product sales, summary off, timeframe by hour or day | Back Office > Reports > Product sales | Back Office > Reports > Tills, then a till's Z ticket for discounts and cancellations | Back Office > Reports > Payment Reports; card fees in SumUp Dashboard > Reports > Fee Invoices |
| Toast | Reports > Sales > Sales summary (day-of-week and time-of-day charts) | Reports > Menus > Product mix | Reports > Cash and loss management > Voided orders and Discounts (both by server), Refunds | Payments Summary card in the Sales summary |
A pub manager who only ever opens Square's Point of Sale app sees the sales summary and nothing else; the item, void and payment reports live in Square Dashboard. Epos Now exports reports only from a computer. If you take payments with the SumUp app rather than SumUp POS Pro, your reports sit in SumUp Dashboard under Reports: sales, revenue, transactions, payouts and fee invoices.
Which hours are losing money?
Sales by hour and day show which hours pay for the people on shift and which do not, so you can move staff time to where it earns before you think about cutting it. Owners are cutting already. The average hospitality business on the recruitment platform Limber posted 112 shift hours a month in 2022 and 79 in 2025. Danny Matthews, who owns The Pennycress, a coffee shop in South Cerney, Gloucestershire, put the choice bluntly to Not Ltd in January 2026: "You either cut hours, cut yourself a wage, or close." The hourly report tells you which hours; in Australia, where penalty rates change what each hour costs, our café guide works out the sales each rostered hour needs under the award.
Take a neighbourhood café open 8am to 5pm with two people on until close. Over four weeks, its 4pm to 5pm hour on Mondays to Thursdays averages £42 through the till, about seven sales. Take off 20% VAT and that is £35. If food and drink cost you about 30p in every pound, £24.50 is left to pay for the hour.
Two people cost about £32 for it. That is the National Living Wage of £12.71 (rising to £13.21 in April 2027) coming to about £16 for each hour worked once employer National Insurance, pension and paid holiday are counted; our guide to the real cost of an hour of staff has the full sum. So the hour loses about £7.50 a day, and with one person on it makes about £8.50. Sending one person home at 4pm on four weekdays saves about £16 a day, roughly £3,300 a year, and every pound of it is somebody's pay. Moving the hour instead, to where the report says you are short, say 11am to 1pm on a Saturday, keeps their pay. Each moved hour pays for itself once the extra pair of hands rings up about £27 more through the till.
Short days can cap takings: a café in East London that Super44 works with found that closing at 4pm capped a day at about £804 in takings, while staying open to around 8pm took £1,062 or more. Run the hourly sum on hours like those before you cut them.
Read an hour together with the hours either side of it. Our busy café guide has a calculator for how many sales each staffed hour needs, and sales per labour hour compares dayparts on one number. If you do cut hours, our guide to the new shift-notice rules covers what is changing for staff on short notice.
Which dishes should you push, reprice or drop?
The product mix report ranks every item by units sold and takings. Put a plate cost beside each line and you can see which dishes earn their place on the menu. A bar in Germany that Super44 works with scored its new food menu this way: four new dishes did €576 in 13 trading days, 63 sold and nearly 20% of that month's food revenue, and the report showed its highest-margin dish was the one under-selling.
Take a gastropub with 16 mains. Four weeks of product mix show the fish pie sold 210 at £17 and the duck sold 18 at £23. Its recipes and latest invoices put the plate cost at £4.90 for the pie and £8.60 for the duck. After 20% VAT, each duck earns £10.57 against £9.27 for a pie. Over the four weeks, though, the pie earned about £1,950 and the duck about £190.
The duck also needs its own stock, its own prep and a chef's attention on a busy Saturday. Give it four weeks in a better spot on the menu, with servers recommending it. If it still sells fewer than 20 a month, take it off. The pie gets the opposite treatment: protect it, then test a price. If it keeps selling 210, another 50p on the pie is about £88 every four weeks after VAT. Our guides to what moves sales on the menu itself and raising prices without losing regulars cover the next step.
Cutting can be the bigger win. A homemade-cakes café in Cologne narrowed its counter to its five best-selling cakes and cut the rest, which saves it €500 to €700 a month with less waste and less baking stress. Before you cut, check that every dish is on the list: Toast's product mix may hide items with no sales in the chosen dates, and the dish that sold nothing is the one you most need to see.
Where is money leaking at the till?
The voids, refunds and discounts reports show money that was rung in and never arrived, and more of it is mistakes than theft, so read them by staff member and by hour before you suspect anyone. In observation audits reported in 2019 by the loss consultancy Venners, losses turned up in every hospitality site, and almost half (46%) came from human error against 39% from theft. Malcolm Muir, a consultancy director at Venners, set out the starting point in The Caterer:
It’s not a case of if a hospitality business will incur financial loss due to error or theft, it’s when.
Say a pub takes £14,000 a week. Last week its void report showed £420, or 3% of sales, against an average of £170 (about 1.2%) over the four weeks before. Each percentage point is £140 of rung-in sales a week. Filter by staff and hour, and the jump sits on Friday and Saturday between 9pm and 11pm, on two new starters using the handhelds.
Not every void costs the same. A void before the order reaches the kitchen or bar costs nothing. A void after it is sent costs the plate or the pint. A run of voids on tables already paid in cash near close is the one worth a closer look, because a voided cash sale can hide cash leaving the drawer. Lightspeed's Staff performance report shows voids for each employee who worked a day, Toast's Voided orders report breaks them down by server, and Epos Now's Void Lines report filters by staff. Rank people by voids as a share of their own sales rather than in pounds, or your busiest bartender tops the list every week.
The fix for the pub is cheap. Require a manager's approval for any void after an order is sent, ask for a reason on every void, and spend ten minutes on the handheld with the two new starters. Then check the same report next Monday. US till maker Lavu says most restaurants aim to keep voids under 1% to 2% of sales; treat that as a rough ceiling and your own trend as the real test.
Being seen to watch the till data changes behaviour too. In a 2013 study of 392 US restaurants that installed software monitoring their till data for theft, theft fell 22% and revenue rose by an average of $2,982 a restaurant a week, about 7%. Lamar Pierce, then an associate professor of strategy at Washington University in St. Louis and one of the study's authors, said of the system: "it’s not more surveillance, it’s better and less intrusive monitoring."
Discounts leak the same way. Muir names staff food and drink with no stated allowance as part of the most frequent kind of loss, along with staff discounts passed on to friends and family. Write down the staff allowance, give every discount its own named button with a reason, and read the discounts report by staff member. Refunds carry a cost too: Square keeps its processing fee when you refund a card payment.
What do card payments really cost you?
The payment-type report splits your takings between card, cash and anything else, and where you take cards through the till's own payments it shows what you were charged, which gives you your real card rate. Square charges 1.75% on UK cards in person but 3.25% on cards issued outside the UK, so a restaurant taking a quarter of its card sales from visitors pays about 2.1% overall.
Say a city-centre restaurant near a museum takes £12,000 a month on card through Square. Its payment methods report, which splits takings by card origin, shows £3,000 of that on non-UK cards. The UK cards cost £157.50 at 1.75%. The foreign cards cost £97.50 at 1.75% plus Square's extra 1.5%. That is £255 a month, an effective 2.1%, or £3,060 a year.
Divide fees by card takings every month. When your effective rate sits well above the headline, the usual reasons are foreign cards, keyed-in payments (2.5% on Square) and refunds on which the provider keeps its fee. Ask your current provider for a better rate before you think about moving, because changing card provider can mean changing till. For comparison, SumUp's pay-as-you-go rate is 1.69%, and it offers bespoke fees to businesses processing £10,000 or more a month. Our card fee calculator runs your own turnover through the published UK rates.
You cannot pass the fee on to guests. HM Treasury banned surcharges for paying by debit or credit card from 13 January 2018. Cash carries no card fee, but it costs counting time, bank deposit charges and the risk of a short drawer, so steering guests towards it to save 1.75% rarely pays.
What your till reports cannot tell you
A till records what you sold and for how much; it does not know what the food cost you or what the people on shift cost you, and those two lines decide whether a busy week made money. PL Coffee Shop Consulting says total employment cost should sit at 28% to 35% of sales for a UK independent café, and that whole line lives in your rota and payroll, outside the till. It puts a food-led site with a kitchen at 33% to 40%.
Lightspeed's Product Mix Report and SumUp's Product sales report do carry cost and margin columns. They are only as good as the cost prices you have typed into the back office, and supplier prices move every month. Plate cost comes from the recipe and your latest invoices; our food GP calculator works it out with yield loss. Wage cost comes from the rota, with National Insurance, pension and holiday added. Put both beside the till's sales before VAT once a week and you have prime cost. Our prime cost guide sets out the weekly tally and how to tell which half to fix first. If keeping cost prices current by hand is the part that never happens, our comparison of café profit software sets out what each tool costs and which ones read your invoices for you.
A 20-minute Monday read
Read the four reports once a week, at the same time, for the last four weeks against the four before, and change one thing at a time. Run every change these reports suggest as a four-week trial you can roll back, and judge it against the same weekdays before it. A cocktail bar in Germany that Super44 works with trialled earlier closing Tuesday to Thursday for four weeks and kept it.
Your Monday read, in order
- HoursFind the three hours with the fewest sales per person on shift, and the hour where the queue is longest.
- DishesList the bottom five items by units and the top five, then put a plate cost beside each bottom dish.
- Voids, refunds and discountsWrite each as a share of sales, by staff member and by hour, and look hardest at voids after an order was sent.
- Card feesDivide fees by card takings and compare the result with your headline rate.
- One changePick one thing to change, write down the date, and judge it four weeks later in the same report.
Compare the same weekdays before and after a change, and check the hours either side of any hour you change.
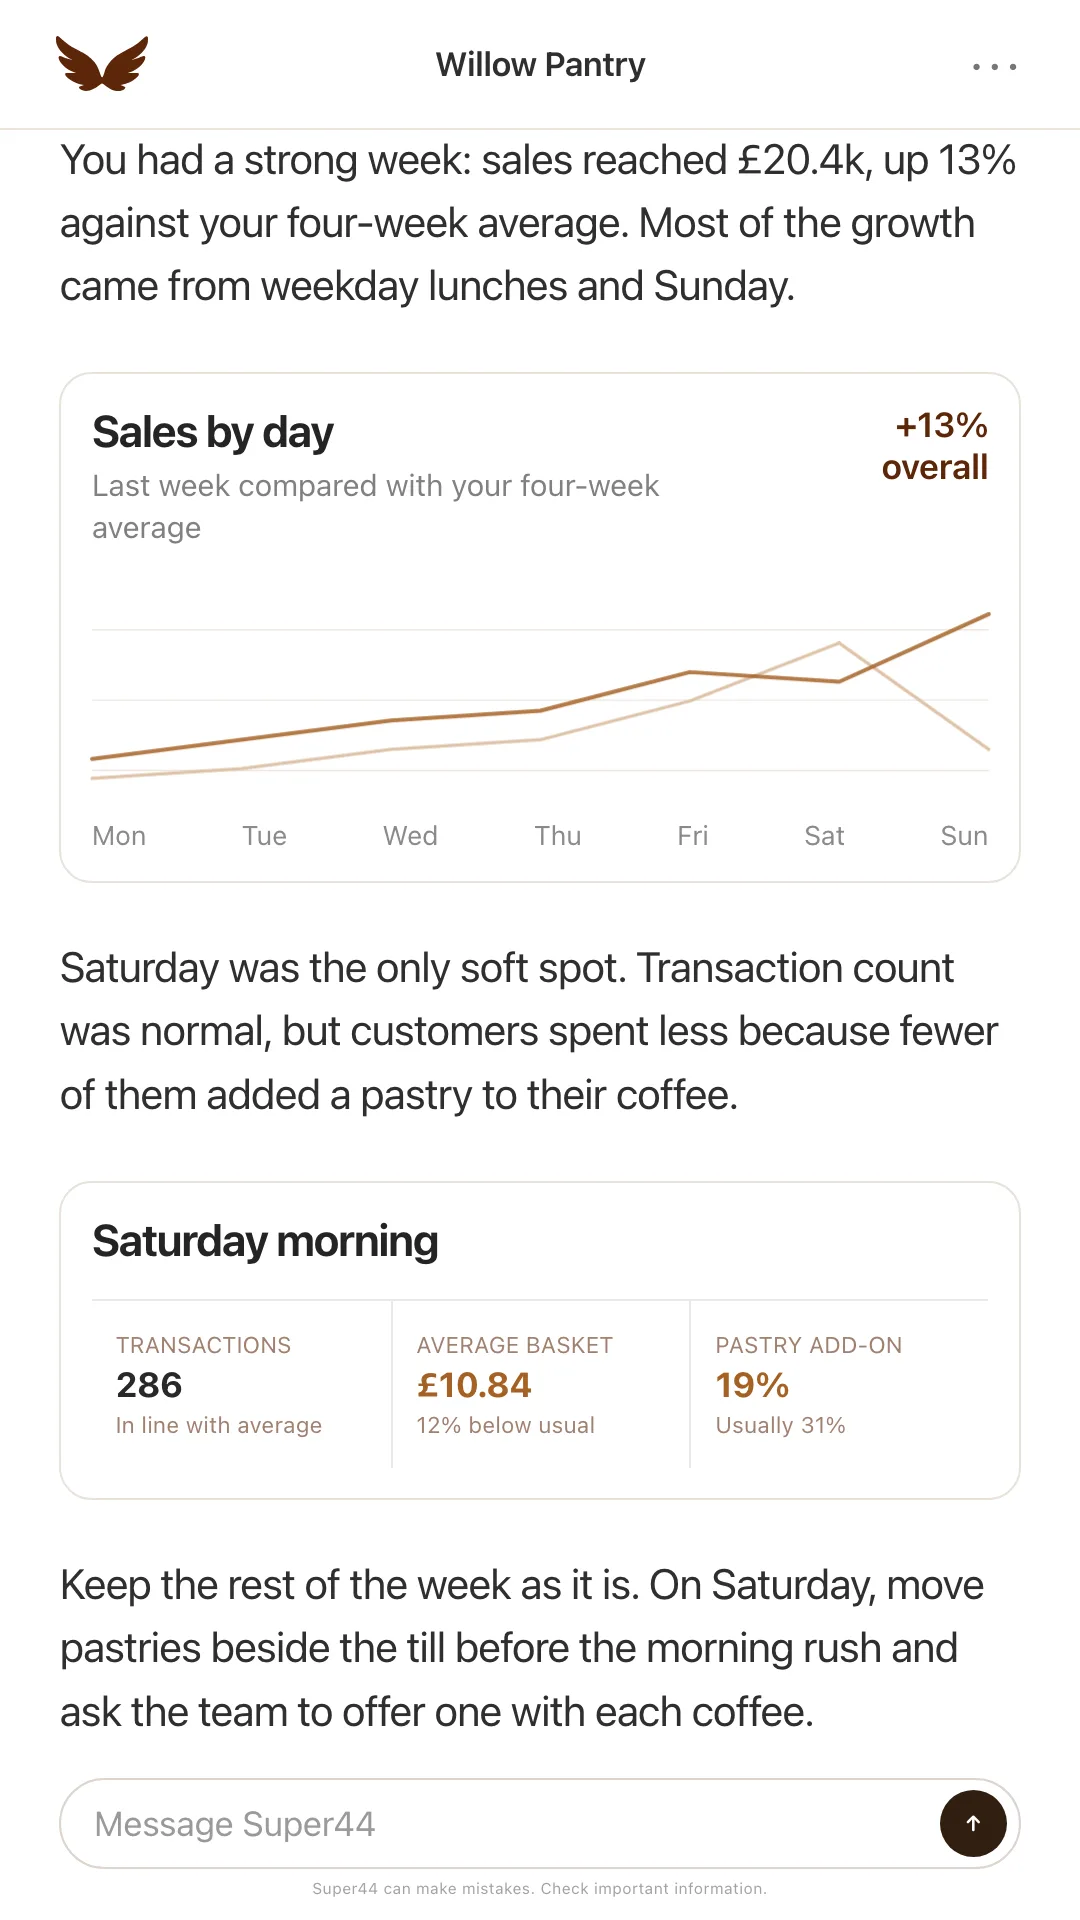
Done by hand, that is twenty minutes, four reports and a notebook every Monday, and it is the twenty minutes that slips first in a busy week. Super44 does the reading every night instead. Connect whichever till you use; if it isn't connected yet, we connect it. At 8am you get a short message on your phone. It gives yesterday's takings against the same day last week and, when something moved, the hour or dish behind it and one thing to try today. Ask it which hours were quietest last month or which dish slipped, and it answers from the same till data. Super44 is free to start; the till connection and the morning brief are part of Core at £19 a month.
When should you ignore what the report says?
Overrule a report when the history is too short, the weeks are not comparable, or the number misses what an hour or a dish does for the rest of your trade. The homemade-cakes café in Cologne found its trailing 30-day average understating a new product that was selling well, and kept it. A 30-day average for an item launched a fortnight ago still counts the days before it existed, so judge a new dish on its weekly sales since launch.
Compare seasonal weeks with the same weeks last year. Our dead season playbook sets a café's July and August trading days beside the national pattern. Strip out the one-off days too: a wet bank holiday or a home match tells you about the weather or the fixture list rather than your menu, and our guide to how weather affects restaurant sales shows how to measure your own rain penalty.
Some numbers miss the point. A vegetarian main selling 15 a month may be the reason a table of six books. A quiet 4pm hour may be where the regular who comes back for dinner first walks in. Reverse a change when the hours either side of it fall, when regulars ask after the dish, or when the people on shift at the peak are stretched.
Frequently asked questions
How do I use my POS data to reduce costs in my restaurant?
Read four reports from your till every week, comparing the last four weeks with the four before: sales by hour and day to move staff hours out of the quiet slots, product mix to decide which dishes to push, reprice or drop, voids, refunds and discounts to tighten who can take money off a bill, and takings by payment type to find your real card rate. Change one thing at a time and trial it for four weeks. Add plate costs from supplier invoices and wage costs from the rota, because the till holds neither.
Where am I losing money in my small restaurant?
Usually in four places a till can show you: hours with more people on shift than the sales pay for, dishes that sell too few to justify their stock and prep, voids and discounts after an order has been made, and card fees above your headline rate. A café hour taking £42 with two staff on loses about £7.50 once VAT, goods and wages are paid. The fifth place, food and wage costs running above their bands, needs your invoices and rota beside the till.
What is a normal void percentage for a restaurant?
US till maker Lavu says most restaurants aim to keep voids under 1% to 2% of sales. Treat that as a rough ceiling and watch your own trend instead: a pub whose voids jump from 1.2% to 3% of sales in a week has a problem worth finding, usually training on a new handheld or a missing approval rule, whatever the benchmark says.
Can I charge customers extra for paying by card in the UK?
No. HM Treasury banned surcharges for paying by debit or credit card from 13 January 2018, so the fee has to come out of your margin. Keep it down by knowing your effective rate: card fees divided by card takings, which your payment-type report shows. Foreign cards, keyed-in payments and refunds are what push it above the headline.
Is there software that reads my till reports for me?
Yes. Super44 connects to whichever till you use, reads it every night and sends a short brief to your phone at 8am: yesterday against the same day last week and, when something moved, the hour or dish behind it and one thing to try. It is free to start; connecting the till is part of Core at £19 a month.
Sources
- Square UK: View sales summary, sales trends and payment methods reports — Reports > Sales > Sales summary (All day or Custom time; Summary Daily, Weekly or Monthly); Reports > Sales > Sales trends; Reports > Payments > Payment methods, with fees by tender type and breakdowns by card origin. The Point of Sale app shows only the sales summary. Checked 6 November 2026.
- Square UK: View item, category and modifiers sales reports — Reports > Custom > Custom item report: item name, quantity sold, gross and net sales. Checked 6 November 2026.
- Square UK: View discounts, comp and void reports — Reports > Payments > Discounts, Comps and Voids; comp and void must be enabled in Square Dashboard before the reports appear. Checked 6 November 2026.
- Square UK: Manage customer refunds — "When you refund a payment, the processing fees for the payment aren’t refunded back to you." Checked 6 November 2026.
- Square UK pricing — In person: 1.75% for transactions with UK cards; 1.75% + 1.5% for non-UK cards. Manually entered: 2.5% per transaction. Checked 6 November 2026.
- Lightspeed Restaurant (K-Series): Understanding the Hourly Sales Report — Reports > Hourly Sales; filter by day of the week and shift; columns include refunds, discounts, voids and comps for each hour; up to 31 days, one location. Checked 6 November 2026.
- Lightspeed Restaurant (K-Series): Product Mix Report — Reports > All reports > Product Mix Report; columns include quantity, sales, returned amount, costs and margin. Checked 6 November 2026.
- Lightspeed Restaurant (K-Series): Understanding the Sales Summary — Reports > Sales Summary: discounts and comps, voids, refunds and payments by method. Checked 6 November 2026.
- Lightspeed Restaurant (K-Series): Understanding the Staff Performance report — Reports > Staff performance: refunds, discounts, voids and comps by day, expandable to the employees who worked that day. Checked 6 November 2026.
- Epos Now: Sales Report — Reporting > Sales Reports: Time Intervals (sales by date and time), Time Period (sales by day), Sales by Product, Employees. Checked 6 November 2026.
- Epos Now: Auditing Reports — Reporting > Auditing: Refunds, Discounts, No Sales and Void Lines, each filterable by staff. Checked 6 November 2026.
- Epos Now: Tenders Report — Reporting > Banking > Tenders: transactions, totals and percentage of turnover by tender. Checked 6 November 2026.
- SumUp POS Pro: Product Sales Report — Back Office > Reports > Product sales; filter by start and end hour; with the summary off, history by hour, day, week, month or year; quantity, costs and margins. Checked 6 November 2026.
- SumUp POS Pro: Tills Report and Z Ticket — Reports > Tills; each Z Ticket shows discounts applied, total cancellations and payment methods. Checked 6 November 2026.
- SumUp POS Pro: How to use payment reports — Back Office > Reports > Payment Reports: payment method and seller for each payment. Checked 6 November 2026.
- SumUp UK: Dashboard reporting tools — SumUp Dashboard > Reports: Sales, Revenue, Payout, Fee Invoices and Transaction reports. Checked 6 November 2026.
- SumUp UK pricing — Pay-as-you-go 1.69% transaction fee; bespoke fees for businesses processing £10,000 or more a month. Checked 6 November 2026.
- Toast: Sales Summary Report Overview — Reports > Sales > Sales summary: sales by date, day of week and time of day; Void Summary card; Payments Summary card by payment type. UK and Ireland cards show sales including VAT. Checked 6 November 2026.
- Toast: Menu Reports Overview — Reports > Menus > Product mix; filter by hour; items with no sales in the selected range may be hidden by default. Checked 6 November 2026.
- Toast: Cash and Loss Management Reports Overview — Reports > Cash and loss management: Voided Orders (voids by server and by approver), Discounts (by server), Refunds. Last updated 2 October 2026.
- GOV.UK: National Minimum Wage and National Living Wage rates — £12.71 an hour for workers aged 21 and over from April 2026; £13.21 from April 2027. Checked 6 November 2026.
- GOV.UK: VAT rates — Standard rate 20%.
- HM Treasury: Card surcharge ban means no more nasty surprises for shoppers — Surcharges for paying by debit or credit card banned from 13 January 2018. Published 13 January 2018.
- Not Ltd: Hospitality shift hours fall 30% as small operators cut back to survive rising costs — Limber data: the average hospitality business posted 112 shift hours a month in 2022 and 79 in 2025. Source of the Danny Matthews (owner, The Pennycress, South Cerney) quote. By Jamie Young, 5 January 2026.
- The Caterer: How to... prevent loss through fraud and staff error — Malcolm Muir, consultancy director, Venners: losses found in 100% of hospitality sites in observation audits; 39% attributable to theft, 46% to human error. 19 December 2019.
- Washington University in St. Louis: IT monitoring effective in deterring restaurant fraud — Pierce, Snow and McAfee, 392 US restaurants: after till-data monitoring software was installed, revenue rose an average of $2,982 a restaurant a week (about 7%) and theft fell 22%. Source of the Lamar Pierce quote. 3 September 2013.
- Lavu: How to Handle Restaurant POS Void and Comp Tracking — US till vendor: "Most restaurants aim for a void percentage under 1-2% of sales." Checked 6 November 2026.
- PL Coffee Shop Consulting: Coffee shop staff costs UK — Total employment cost 28% to 35% of sales for a UK independent café, including employer National Insurance, pension and holiday pay; food-led sites with a kitchen usually 33% to 40%. Checked 6 November 2026.